Financial markets ended the 2nd quarter of 2022 just as they began, offering investors no reprieve from the unease and uncertainty that has defined much of the year’s first half. Together, U.S. investment-grade fixed income[1] and equity[2] indices closed out their weakest start to the calendar period in nearly 50 years. At the same time, the interplay of ongoing inflation challenges and China’s evolving COVID policies continues to impact market performance and outlook.
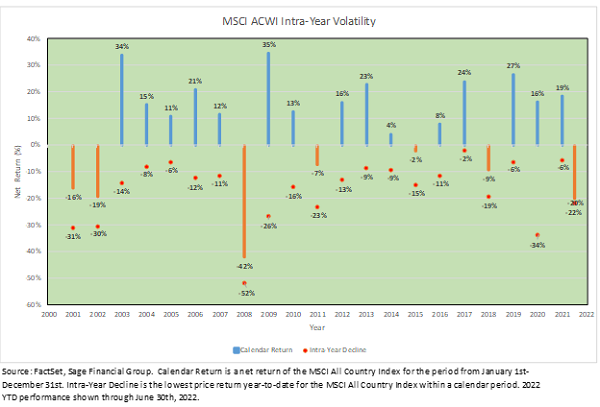
We recognize that ongoing volatility like this can create stress, and we, too, feel it. The best thing to do is remain patient and sit tight. It is hard, but market volatility is part of being an investor. Equity market sell-offs do occur, with 20% declines transpiring, on average historically, once every four years. It is also helpful to remember that the current weak performance follows three consecutive strong years for most asset classes.
In this edition of Insights, we recap this fast-changing market environment, share our thoughts on the drivers of recent inflation, and discuss the implications of a shift in China’s COVID policy and the conflict in Europe.
Continued Selling Pressures and Historic Bond Challenges
In equity markets, U.S. large-cap stocks experienced selling pressure throughout June, declining by 8.38%. Most of the decline occurred in the first half of the month, as investor uncertainty grew around the Federal Reserve’s increasingly aggressive policy to contain inflation and its impact on economic growth. International stock indices had a similarly challenging month, with the most widely quoted index down 8.60% in June. Emerging market stocks fared modestly better, down 6.64%.[3]
For every one step forward, global equities took two steps back. The FOMC’s decision to increase the fed funds rate by 0.75% was the largest single meeting policy rate increase since 1994. The move has created a fresh headwind for the economy, which has seen activity slow in recent months.
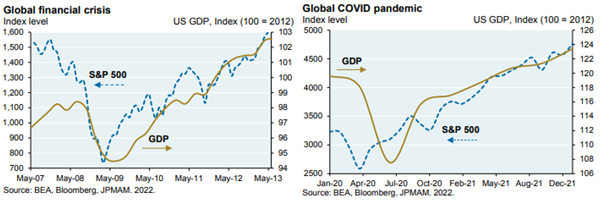
There is a possibility that Q2 economic growth is negative, which would register as a “technical recession” (i.e., two consecutive quarters of negative after-inflation economic output). The National Bureau of Economic Research (NBER) makes the official determination, but the possibility of a recession contributed to the 8.43% decline in global equities in June, down 20.18% year-to-date. That said, as we shared in June’s Our Perspective, in past recessions, financial markets typically bottom before economic growth begins to recover. As shown below, towards the end of the Global Financial Crisis, U.S. Large Cap stocks began to recover in March 2009, but the recession did not end until the following summer.
This month, we would be remiss if we did not devote some additional focus to the 10.35% decline in the Bloomberg Barclays U.S. Aggregate Index. This is the worst start to the year for investment-grade corporate and sovereign bonds since the index’s inception in 1976. Throughout the year, investors have expected a rise in interest rates to erode the value of bonds. Even so, the speed of this development has been quicker than anticipated. If there is a thin silver lining to be found, it’s that bond yields are higher today, which may provide additional income to investors in the future. Additionally, futures markets are indicating interest rates could begin to fall early next year, which is expected to support bond returns going forward.
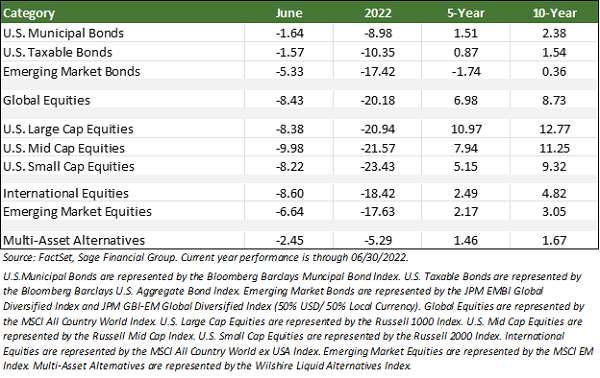
Although nearly all global asset classes have declined through the first six months of the year, disciplined investors who adhere to Sage’s philosophies should consider longer-term returns and historical context. We have seen turbulent times before. Since 2001, despite the 17.09% average calendar year equity drawdown, 68% of years have finished positively, and the average return has been 7.24% per annum. At the same time, the 5- and 10-year returns of global equities through June 2022 have been 6.98% and 8.73%, annualized.
Inflation Delivers an Unpleasant Surprise
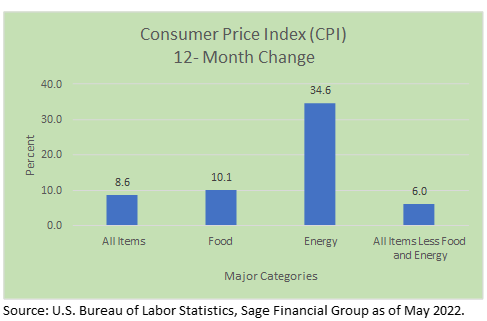
Inflation has continued to be stickier than most anticipated. The May U.S Consumer Price Index (CPI) report kicked off the month and provided the largest print in 40 years, with prices increasing for consumers by 8.6% year-over-year. Excluding the volatile energy and food sectors, elevated airline and auto prices were key drivers of the increase. Higher inflation has led to a more aggressive Federal Reserve and higher interest rates and has contributed to lower equity and bond prices this year.
Prices continue to rise at a rate higher than consumers desire. Collectively, food and energy comprise roughly 21% of the CPI. Both categories have had a pronounced impact on consumers, rising 10.1% and 34.6% year-over-year, respectively, as of May 31. The price of gasoline has risen nearly 50% in the United States over the past year and continues to weigh on consumers’ personal finances, as well as corporate profits, by way of higher input costs.
In the near term, there is no quick fix for these volatile categories, as demand tends to be more stable for food consumption and driving. Central bankers are constrained in how much they can impact the price of food and energy on the supply side and, over the near term, will engage in a balancing act of restricting consumer demand without creating an economic recession.
In our view, the Fed will likely continue raising interest rates throughout 2022 to moderate inflation while attempting to minimize damage to the labor market. However, the Fed has stated that it will be data-dependent in efforts to get inflation under control, adapting its policy to new data points. At the June 15 FOMC press conference, Fed Chairman Jerome Powell cited inflation and consumer data released just days before the committee’s meeting.
We recognize that raising rates at this rapid pace does increase the risk of a recession, particularly as higher commodity prices are weighing on the economy. Today, we have a balanced outlook on future market returns. We continue to expect sharp interest rate fluctuations and recommend integrating flexible fixed income into portfolios to mitigate the impact of volatile interest rates.
Shift in China’s ‘Zero-Covid Policy’
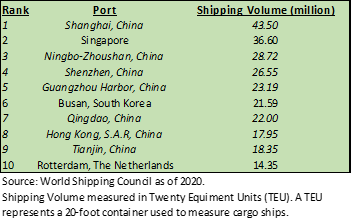
As we’ve noted over the last several months, China’s continued zero-tolerance approach to COVID has led to supply chain disruptions. Over the last 20-plus years, China has become a critical input within global supply chains due to its manufacturing strength and shipping capabilities. Across the globe, 7 of the 10 largest seaports are located in China. This month, we began to see the impact of reopenings in places like Shanghai, the largest city in China with nearly 25 million residents (3 times the population of New York City), following its two-month lockdown. This included permitting in-person dining and the reopening of popular tourist venues, including a Disney resort.
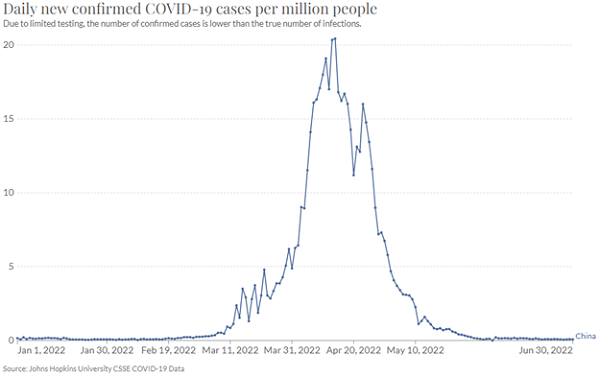
Beijing and Shanghai have been able to slowly re-open, which may help ease supply chain issues and contribute to global growth. China’s most recent peak of COVID cases was in mid-April, and the country has since seen a precipitous decline. Unfortunately, it is impossible to know if another wave of cases could occur in the near term. For now, it seems that the country’s economic activity can continue to restart, with the bar for further lockdowns becoming higher.
In our view, significant uncertainty remains regarding China’s COVID policy, but there are some early signs that China’s reopening may continue. This would be positive for economic growth and help ease inflationary pressure worldwide. Additionally, positive market sentiment from the world’s second-largest economy could be a tailwind for emerging market equity and bond strategies in the second half of 2022.
Geopolitics in Europe
We continue to share the anguish and anxiety created by the conflict in Ukraine, and we hope for a near-term resolution.
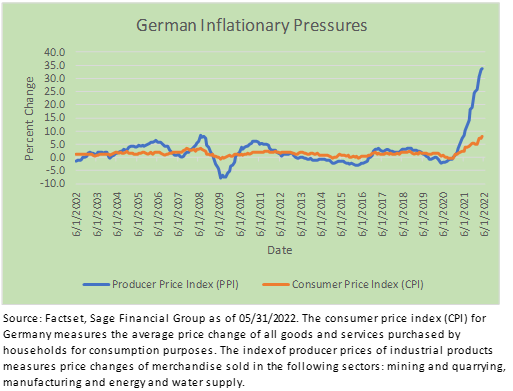
Although Russia’s invasion of Ukraine has had the most direct impact on European countries, as they exhibit the highest dependence on Russian energy, its effects are felt globally through higher oil and gas costs. Toward the end of June, for the first time since the beginning of the war, Russia restricted natural gas to Germany. In response, the German economy is witnessing the most elevated inflationary period in 40 years, breaking 20 years of relatively calm price increases.
Developments like these demonstrate that this conflict continues to create significant uncertainty in Europe and around the globe. In response, Sage has sought to minimize cyclical exposure to Europe within portfolios as the economic environment remains highly uncertain. Earlier this year, we recommended that most clients exit the international small-cap position in favor of strategies that focus on higher-quality companies. We believe quality companies may provide higher revenue certainty, profitability, and lower volatility through an inflationary environment.
Closing Thoughts
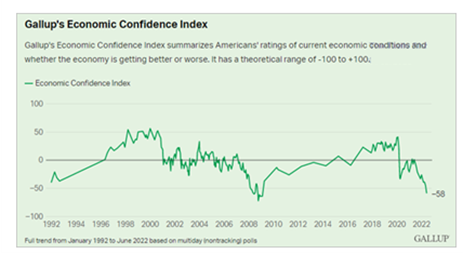
The first half of 2022 hasn’t been easy for investors. Markets have been challenged, and the uncertainty that came with those challenges has impacted investor and consumer sentiment.
Despite those challenges, Sage maintains a balanced outlook on the economy and the financial markets. We’re confident in our planning and the tools we have in place to guide our clients through periods of volatility. This is not the first bout of volatility we’ve been forced to navigate. And while we’re committing our full focus and resources to potential negative developments, we’re not losing sight of opportunities, either.
There have been only three other periods in history in which the S&P 500 declined by 20% or more in the year’s first half. Although there is no guarantee that history will repeat itself, in each of those three periods (1932, 1962, and 1970), the index provided a positive return in the second half of the year.
We will continue to rely on the investment principles that have anchored Sage since its founding in 1989. Our focus is on crafting portfolios that are well-diversified, structured to reduce volatility over time, and informed by our understanding of your financial goals, risk tolerance, time horizon, and return objectives.
[1] U.S. investment grade fixed income is measured by the Bloomberg Barclay’s Aggregate Index as of 06/30/2022.
[2] U.S. equity is measured by the Russell 1000 Index as of 06/30/2022.
[3] U.S. Large Cap stocks represented by Russell 1000 Index, Global Equities by MSCI All Country World Index, International Equities by the MSCI All Country World Ex-USA Index, Emerging Market Stocks by the MSCI Emerging Markets Index, and U.S. Investment Grade Bonds by the Bloomberg Barclay’s U.S. Aggregate Index.
Previous Posts
Our Perspective on the Current Market Environment
Sage Insights: Geopolitics, Earnings, and Investing Principles
Sage Recognized for Commitment to Clients
Learn More About Sage
The information and statistics contained in this report have been obtained from sources we believe to be reliable but cannot be guaranteed. Any projections, market outlooks, or estimates in this letter are forward-looking statements and are based upon certain assumptions. Other events that were not taken into account may occur and may significantly affect the returns or performance of these investments. Any projections, outlooks, or assumptions should not be construed to be indicative of the actual events which will occur. These projections, market outlooks, or estimates are subject to change without notice. Please remember that past performance may not be indicative of future results. Different types of investments involve varying degrees of risk, and there can be no assurance that the future performance of any specific investment, investment strategy, product or any non-investment-related content, made reference to directly or indirectly in this newsletter will be profitable, equal to any corresponding indicated historical performance level(s), be suitable for your portfolio or individual situation or prove successful. Due to various factors, including changing market conditions and/or applicable laws, the content may no longer be reflective of current opinions or positions. All indexes are unmanaged and you cannot invest directly in an index. Index returns do not include fees or expenses. Actual client portfolio returns may vary due to the timing of portfolio inception and/or client-imposed restrictions or guidelines. Actual client portfolio returns would be reduced by any applicable investment advisory fees and other expenses incurred in the management of an advisory account. Moreover, you should not assume that any discussion or information contained in this newsletter serves as the receipt of, or as a substitute for, personalized investment advice from Sage Financial Group. To the extent that a reader has any questions regarding the applicability above to his/her individual situation of any specific issue discussed, he/she is encouraged to consult with the professional advisor of his/her choosing. Sage Financial Group is neither a law firm nor a certified public accounting firm and no portion of the newsletter content should be construed as legal or accounting advice. A copy of the Sage Financial Group’s current written disclosure statement discussing our advisory services and fees is available for review upon request.
Sage Financial Group has a long track record of citations and accolades. Rankings and/or recognition by unaffiliated rating services and/or publications should not be construed by a client or prospective client as a guarantee that s/he will experience a certain level of results if Sage is engaged, or continues to be engaged, to provide investment advisory services. Nor should it be construed as a current or past endorsement of Sage by any of its clients. Rankings published by magazines and others generally base their selections exclusively on information prepared and/or submitted by the recognized advisor. For more specific information about any of these rankings, please click here or contact us directly.
© 2022 Sage Financial Group. Reproduction without permission is not permitted.

